It’s been a long time since I posted anything here… and that doesn’t change now, except in a technical sense. My writing activities are currently split between my work for the European Mathematical Society (see here for why you should join) and writing about the current political situation, with which I am greviously displeased, on social media. If you are interested in the latter, see my Twitter account on your right, and I have also started a blog on Medium. The first post is: Remaining Angry.
Elwes Elsewhere
I have a new post at The De Morgan Forum [link updated].
As an ambitious young researcher, you can miss the wood for the trees. When you’re presented with a theorem, your inclination is to dive straight into the proof, and start grappling with the toughest ideas in there. But when you’re addressing a general audience, you have to step back, pause, and ask “What is the point of this theorem? Where did it come from? Why should we care?” You’re forced to adopt a different perspective on the subject, and that’s refreshing.
Read more of my interview over at Math Frolic.
“The parametric engines are jammed! Orthogonal vector’s gone! I’m almost out of ideas!”
I have a guest post at The Aperiodical reporting on the London Mathematical Society’s birthday party last week, where Doctor Who was a recurring theme.
There are many songs in the world about love and loss, heartbreak and heart-ache. There are altogether fewer about algebraic geometry in the style of Alexander Grothendieck. Here is my attempt to fill that gap:
Disclaimer: I hope none of this needs saying, but just in case of misinterpretation:
1. No views expressed therein are attributable to any organisation to which I am affiliated.
2. Most of the views expressed therein are not attributable to me either, but are a deliberate exaggeration, for comic effect, of a common initial reaction to one’s first meeting with Grothendieck-style algebraic geometry.
3. It is not intended as a serious critique of any mathematician or school of mathematics!
Lyrics
When I was a young boy doing maths in class
I thought I knew it all.
Every test that I took, I was sure to pass.
I felt pride, and there never came a fall.Up at university, I found what life is for:
A world of mathematics, and all mine to explore.
Learning geometry and logic, I was having a ball.
Until I hit a wall…For I adore Euler and Erdős,
Élie Cartan and Ramanujan
Newton and Noether. But not to sound churlish
There’s one man I cannot understand.No, I can’t get to grips with Grothendieck,
My palms feel sweaty and my knees go weak.
I’m terrified that never will I master the technique
Of Les Éments de Géométrie Algébrique.He’s a thoughtful and a thorough theory-builder, sans pareil.
But can anybody help me find the secret, s’il vous plaît
Of this awe-inspiring generality and abstraction?
I have to say it’s driving me to total distraction.For instance… A Euclidean point is a location in space, and that we can all comprehend.
René Descartes added coordinates for the power and the rigour they lend.
Later came Zariski topology, where a point’s a type of algebraic set
Of dimension nought. Well, that’s not what I thought. But it’s ok. There’s hope for me yet!But now and contra all prior belief
We hear a point’s a prime ideal
In a locally ringed space, overlaid with a sheaf.
Professor G, is truly this for real?No, I can’t make head nor tail of Grothendieck
Or Deligne, or Serre, or any of that clique.
I’ll have to learn not to care whenever people speak
Of Les Fondements de la Géométrie Algébrique.But don’t take me for a geometrical fool.
I can do much more than merely prove the cosine rule.
I’ll calculate exotic spheres in dimension 29
And a variety of varieties, projective and affine.I’m comfortable with categories (though not if they’re derived)
I’ll tile hyperbolic space in dimension 25
I can compute curvature with the Gauss-Bonnet law
And just love the Leech Lattice in dimension 24.But algebro-geometric scheming
Leaves me spluttering and screaming.
And in logic too, you may call me absurd
But I wouldn’t know a topos, if trampled by a herd.I’ve tried Pursuing Stacks but they vanished out of sight,
I’ve fought with étale cohomology with all my might.
And Les Dérivateurs. It’s 2000 pages long.
I reach halfway through line 3, before it all goes badly wrong.No, I’ll never get to grips with Grothendieck
And I’m frightened that I’m failing as a mathematics geek.
All the same, I can’t deny the lure and the mystique
Of Le Séminaire de Géométrie Algébrique.– Richard Elwes, 2015
Comments are closed on the Youtube page (because obviously) and here (because broken) but open on Google plus, Facebook, and Twitter.
and here
If you’ve got a spare hour[1] at some stage here is a video of a talk I gave last month on Gödel, Incompleteness & Unprovable Theorems.
[1] The joy of the pause button is that the hour doesn’t have to form a single contiguous block.
You can read my interview with Kevin Houston (or should that be Kevin’s interview with me?) on his blog.
[Update June 2015: since I rebooted my site, the wallpaper uses a design which emerged from work George Barmpalias, I, and Andy Lewis-Pye did together on Schelling’s model of racial segregation. This post describes our research.]
I talked in the previous post about a model of racial segregation devised by Thomas Schelling in 1969 [original pdf]. This post will describe how the model works, in its simplest 1-dimensional incarnation, and what we’ve discovered about it. (I hope this post is also accessible to everyone, but I’ve included the formal statements for the more mathematically-minded reader.)
Schelling’s Model
Suppose that a large number of people, say a hundred thousand (or more generally 
Once all the people are in place, each person will only be concerned with their own immediate neighbourhood: say the 80 people to their left, and the 80 people to their right, making its total size 161. (The number 80 is the called neighbourhood radius, or 
Now we have to factor in people’s preferences. Let’s imagine that each person is happy so long as they’re in the majority in their neighbourhood, but they’re unhappy if they’re in the minority. So, if some red individual’s neighbourhood contains 75 red people and 86 blues, she’ll be unhappy. But if contains at least 81 red people, including herself, she’s guaranteed to be happy, since the reds are bound to outnumber the blues. We’ll imagine that everyone feels similarly.
The idea is that unhappy people may then move house (while happy people won’t). To model this, at each time-step we pick, at random, a pair of unhappy people of opposite colours and swap them. This will have knock on effects on the neighbours of those two nodes, who may themselves change from being happy to being unhappy, or vice versa. We keep repeating this until we run out of unhappy people of one colour or other.[1]
Ok, those are the rules. And the big question is: what will the ring look like at the end of this process? And the answer is…

As you can see, distinct red and blue regions have developed. If we want to measure the level of segregation, we need to know how big these areas are.
The first rigorous answer to this question was provided in a recent paper by Christina Brandt, Nicole Immorlica, Gautam Kamath, and Robert Kleinberg. They prove, roughly speaking, that the segregated regions are not significantly bigger than the original neighbourhoods.
More technically, their theorem says this: for any 


Altering the Tolerance
Here’s a new question: what might happen to this picture if we tweak the system to make people more tolerant? Instead of requiring their own colour to be a majority in their neighbourhood, perhaps they’re happy so long as it’s not below 38%, say. Well, this is the picture that emerges if we set the tolerance parameter 

This is, I hope you’ll agree, a rather surprising turn of events. After all, one might naively expect that if people are content with a greater level of mixing, this should be reflected in their final arrangement. But what we’re actually faced with are dramatically larger segregated regions.
In more technical terms the segregated regions have jumped from being polynomial (or conjecturally linear) to being exponential relative to the neighbourhood radius.
In even more technical terms, in our paper, Andy Lewis-Pye, George Barmpalias and I prove that in this situation there exists a number 


Why should this be? Well, we get a hint if I add in some extra information to the pictures. Here’s the first scenario again, where the tolerance is 

The innermost ring is the city’s initial configuration. Outside that are markers for the initially unhappy nodes. Then the body of the ring shows the changes which take place over the course of the run, with distance from the centre proportional to when the change happened. At the outside is the result: the same final configuration we saw before. Now let’s have another look at the case where

In this case, there are visibly fewer initially unhappy nodes. But each of them sets off a domino effect: when they change, the nearby nodes of the same colour become unhappy, and so on. Paradoxically, because almost everyone is initially happy, the resulting firewalls can extend much further before running into each other, which is how the larger segregated regions are formed.
A Threshold Between Segregation and Integration
What if we make people even more tolerant? Suppose 

As you can see, there’s not a lot going on here; now everyone is initially happy, and remains that way. In our paper, we show that the threshold value is (kappa approx 0.353092313 ). More precisely, for those who are interested, it is the root of the following equation[2]:
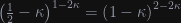
For values of 


This threshold manifests itself very dramatically when running simulations: below it very little happens. Then… boom!
Moving To Total Segregation
Finally, you might wonder what would happen if we make people less tolerant. Perhaps everyone requires their neighbourhood to contain at least 65% of their own colour, meaning 

(This ring has 
In fact, the point 0.5 is another crisp threshold: whenever
[1] Actually what I’ve described is the closed model. There’s an even simpler open model in which we pick at each stage a single unhappy node and change its colour – we might imagine that the unhappy red resident has moved out of the city altogether and been replaced by a blue resident whose moved in from elsewhere. One challenge is to determine to what extent the open model is a reasonable approximation to the closed one.
[2] If you know anything about this number, please let me know!
[3] In this case we adopt the additional convention that someone will refuse to swap if they will be less happy in their new position than in their current one. Also notice that in this case, the process never fully terminates, as the people on the edges of the segregated regions will remain unhappy. But the only thing that can happen after complete segregation has occurred is that the boundaries of the regions shuffle a little this way and that.
Here’s a question:
When a city contains people of different races, segregation often occurs: sizeable parts of town largely inhabited by people of one race. But when asked what sort of neighbourhood they would like to live in, people often report a preference for mixed neighbourhoods. So why does the reality often fail to reflect this desire?
Of course, there are various conceivable explanations. One comes from what economists call revealed preferences, meaning that, when push comes to shove, people may not be quite so keen on mixed neighbourhoods as they thought they were. But there are other, more interesting possibilities. With some friends I’ve recently being doing some mathematical work which is relevant to this question, and which allows us to take people at their word. The interesting thing is: high levels of segregation can emerge even in a city where everyone would be completely happy in a mixed neighbourhood.
It also produces some rather lovely pictures:

In the next post I’ll explain what this picture means and discuss our work in more detail. (Impatient? The preprint is here.) This post is background, and the starting point is a theoretical model of racial segregation devised by Thomas Schelling in 1969. It’s a simple model of a city, in which people may move houses depending on whether or not they are satisfied with the make-up of their current neighbourhoods.
Schelling is best known for his infamous work on game theory at the RAND Corporation during the Cold War. His book on that subject, Strategies of Conflict, is a very readable introduction to these ideas (so long as you don’t mind a little maths), and is accurately summarised by Cousin It as follows:
”Forget rationalist Judo: this is rationalist eye-gouging, rationalist gang warfare, rationalist nuclear deterrence. Techniques that let you win, but you don’t want to look in the mirror afterward.”

Schelling also played an interesting role in the genesis of Stanley Kubrick’s film on this very subject: Dr Strangelove (Or: How I Learned To Stop Worrying And Love The Bomb).
In 2005, Schelling was awarded the Nobel Memorial prize in Economics in 2005 (though not without some controversy). The Academy commented on both his work on strategy and – my focus here – his insights into questions related to racial segregation.
I’ll describe his model in the next post, but as you will see it is very simple indeed. Now, you can view this either as a good or a bad thing. For a mathematician – that’s me – it’s good, since it provides the possibility of a thorough analysis of the mechanisms at work. On the other hand, for a social scientist, it does carry the undeniable disadvantage that the model is a pretty feeble reflection of reality.
So let’s admit from the outset that Schelling’s model town is by no means realistic: it ignores obviously relevant factors such as geography, local amenities, transport, and, well, pretty much anything else you can think of that real people actually care about when choosing where to live. On top of this, it pretends that people live in a beautifully convenient geometrical arrangement, which in reality happens only occasionally.
There have been numerous subsequent modifications of the model to make it more realistic, and therefore presumably more useful to social scientists, for instance by incorporating factors such as house prices. Even so, I hold that Schelling’s original simple model carries a rather profound lesson for us all, not about racial segregation particularly, but more generally about the relationship between the actions of individuals and the larger scale social structures to which they can give rise.
This relationship can be extremely counterintuitive, as discussed in Schelling’s – again very readable and less technical – book on this theme: Micromotives and Macrobehaviour. As he says
“…sometimes the results are surprising. Sometimes they are not easily guessed. Sometimes the analysis is difficult. Sometimes it is inconclusive. But even inconclusive analysis can warn against jumping to conclusions about individual intentions from observations of aggregates, or jumping to conclusions about the behavior of aggregates from what one knows or can guess about individual intentions.”
In particular, in the next post I’ll discuss the surprising finding that when people are more tolerant of neighbours of different races, this may actually lead to greater segregation.
I was invited to give this year’s WP Milne lecture at Leeds Festival of Science. Professor Milne was a maths teacher at Clifton College, before going on to become the head of Leeds University’s maths department. In honour of this slightly unusual career path, the annual Milne lecture is delivered to an audience of sixth form students (aged 16-18), as well as to the members of the Yorkshire Branch of the Mathematical Association.
I was delighted to be asked, both as a general honour, and in particular because I have also spent a (very) little time teaching in schools, before migrating to the university sector.
I spoke about The Maths that Makes the Modern World, and divided my talk into two halves: on the simplex algorithm for linear programming, and on Google’s Pagerank algorithm, topics also covered in my book.
